Introducing ATHOS-T: A No-Code, End-to-End Integrated Transcriptomics Analysis Solution
Athos team
Posted: Jun 30, 2025
Conventional Transcriptomics Analysis
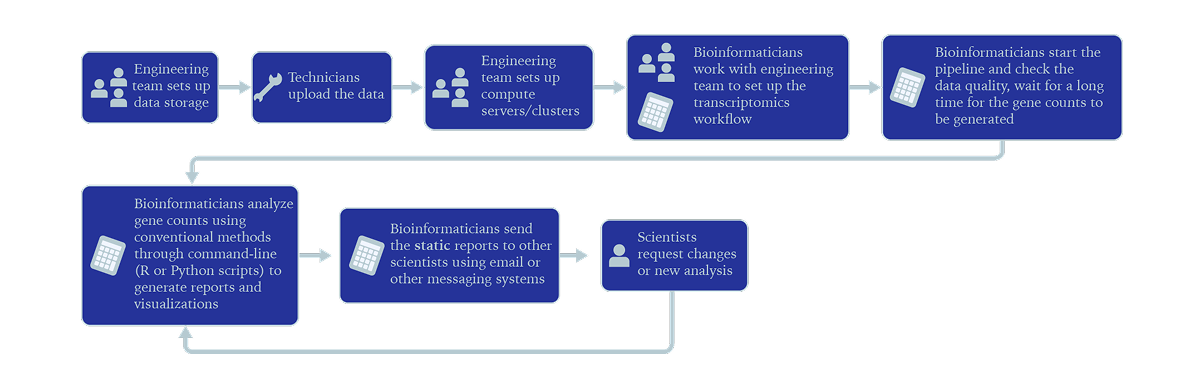
The conventional way of analyzing transcriptomics raw data involves several teams:
- •Engineering team sets up data storage
- •Technicians upload the data
- •Engineering team sets up compute servers/clusters
- •Bioinformatics work with engineering team to set up the transcriptomics workflow
- •Bioinformaticians start the pipeline and check the data quality, wait for up to weeks for the gene counts to be generated
- •Bioinformaticians analyze the gene counts using conventional methods through command line (R or Python scripts) and generate reports and visualizations
- •Bioinformaticians send the "static" reports to other scientists using email or other messaging systems
- •Scientists may request changes (e.g. model, thresholds, etc.) to the bioinformatician and have to wait to receive the new results
This causes many issues for teams and companies:
- •Expertise bottlenecks: Lacking any of the above mentioned skills can be challenging for companies that need transcriptomics data analyses.
- •Poor user experience: Scientists without the command line skills of the transcriptomics toolkits cannot generate the results they would like to review. They have to request and wait for new results even if the updates are minimal.
- •Limited use of automation and AI: Some of the toolkits can be automated with command lines; however, the barrier is still too high for a lot of users.
- •Lack of end-to-end integrated solutions: The conventional way of analyzing the data forces teams to use segmented tools to collaborate with each other. This can be highly error-prone.
- •Reproducibility gaps: When scientists use segmented toolkits, it is very difficult to keep track of requirements, code or parameters changes, which cause difficulties in reproducing the results.
- •Inefficient and costly workflows: When engineers set up the compute servers or clusters, they are not familiar with the details of the computational requirements of the individual tasks inside the workflow. Therefore, a lot of the computational resources are wasted during the computation.
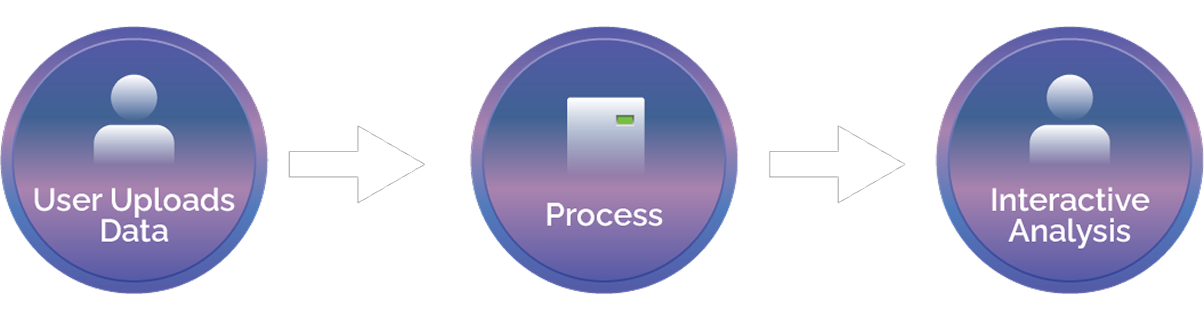
Based on the above mentioned needs, we introduce ATHOS-T, a no code and end-to-end integrated solution for analyzing transcriptomics data. ATHOS-T provides the following innovations:
- •No coding or engineering skills needed for running the transcriptomics analyses
- •Very user-friendly interface guiding users on raw data processing, detailed analyses, report generation, team collaborations, permissions, etc
- •Automated data pipelines and workflows so that users can focus on the analyses part, without worrying about the scalability of the data or compute infrastructure
- •Optimized computational workflow with CPU, GPU, memory and storage hierarchies helping users reduce the cost and increase the overall analytical speed
- •AI-powered discovery assisting users on metadata interpretation, results and visualization explanation
- •Secure and regulatory-compliant
How does ATHOS-T work
Key Features & Functions One-click automation
Digital Material
ATHOS-T Data Analysis Pipeline
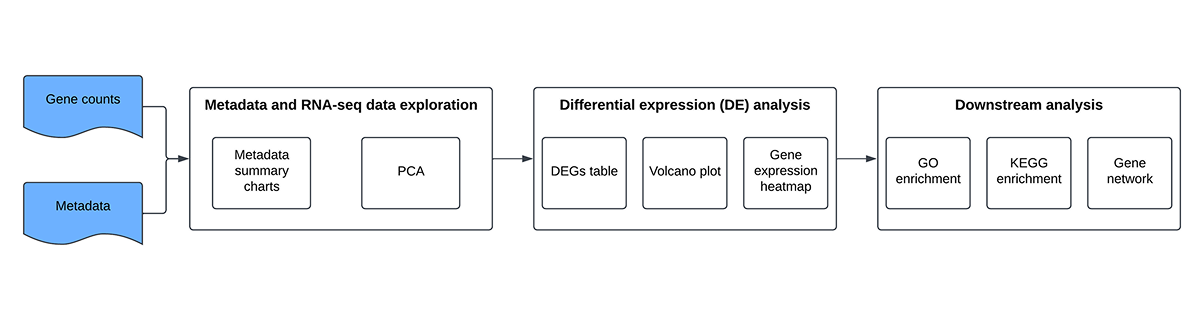
The core objective of the ATHOS-T data analysis pipeline is performing gene differential expression (DE) analysis and generating interactive outputs without any code to facilitate the interpretation of the results and accelerate biological inference and discovery.
The pipeline is composed of three main parts:
- •
Metadata and RNA-seq data exploration: The number of samples across metadata attributes (e.g. sex, diagnosis, treatment, tissue location, etc.) is summarized using charts. Principal component analysis (PCA) is performed and PCA plots are automatically generated to get an overview of the sample grouping. At this step, the user can decide to filter out samples (e.g. outliers), create additional in-silico metadata attributes, etc.
- •
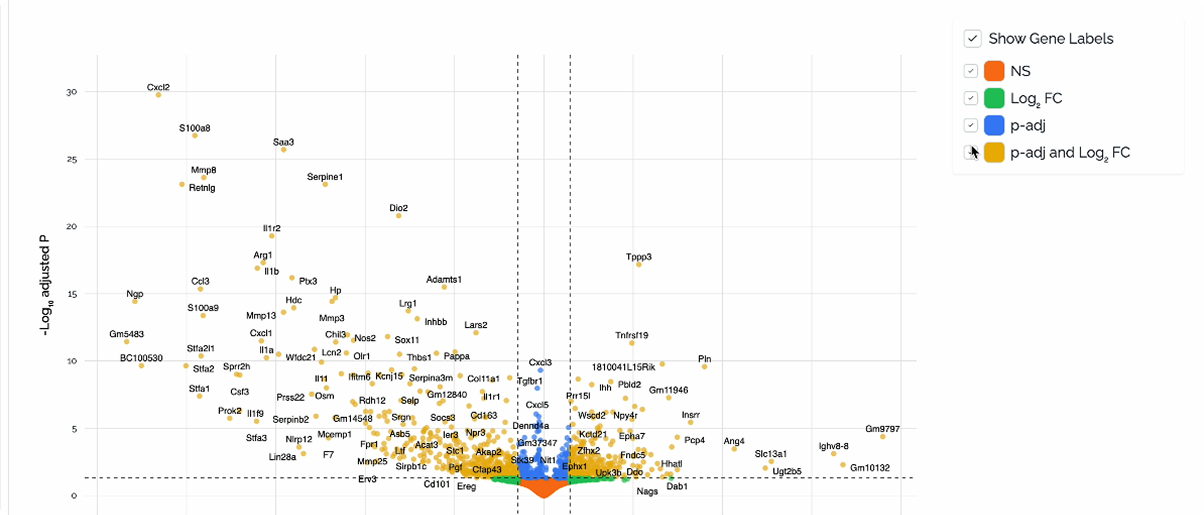
DE analysis: Through a simple and clear UI, the user sets up the comparison (contrast, alternate and reference levels, e.g. treatment, drug, placebo) and runs the analysis with a single click. Results presented in the dashboard include a table with the list of the differentially expressed genes (DEGs), and interactive volcano plot and gene expression heatmap.
- •
Downstream analysis: Gene Ontology (GO) and Kyoto Encyclopedia of Genes and Genomes (KEGG) enrichment analysis from the DEGs to map genes to biological pathways and functional annotations. Gene networks for a custom group of input genes or from one or more enriched pathways.
ATHOS-T Visualization Example: Volcano Plot
Computational Bottleneck of The Raw Transcriptomic Data Processing
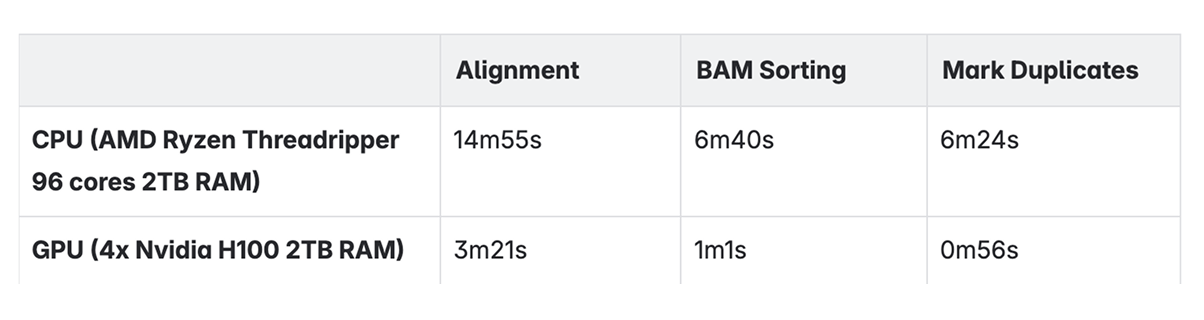
When analyzing raw transcriptomics data, there are many steps involved. The most computationally intense procedures are:
- •Alignment: Mapping reads to the reference genome
- •BAM sorting: Rearrangement of the reads in binary aligned files
- •Mark duplicates: Identifying the duplicate reads in binary aligned files
We ran a human transcriptomics dataset with 64 samples and compared the CPU and GPU performance on these three tasks. The following table shows the wall clock results of average running time per sample.
ATHOS-T with GPU-Acceleration
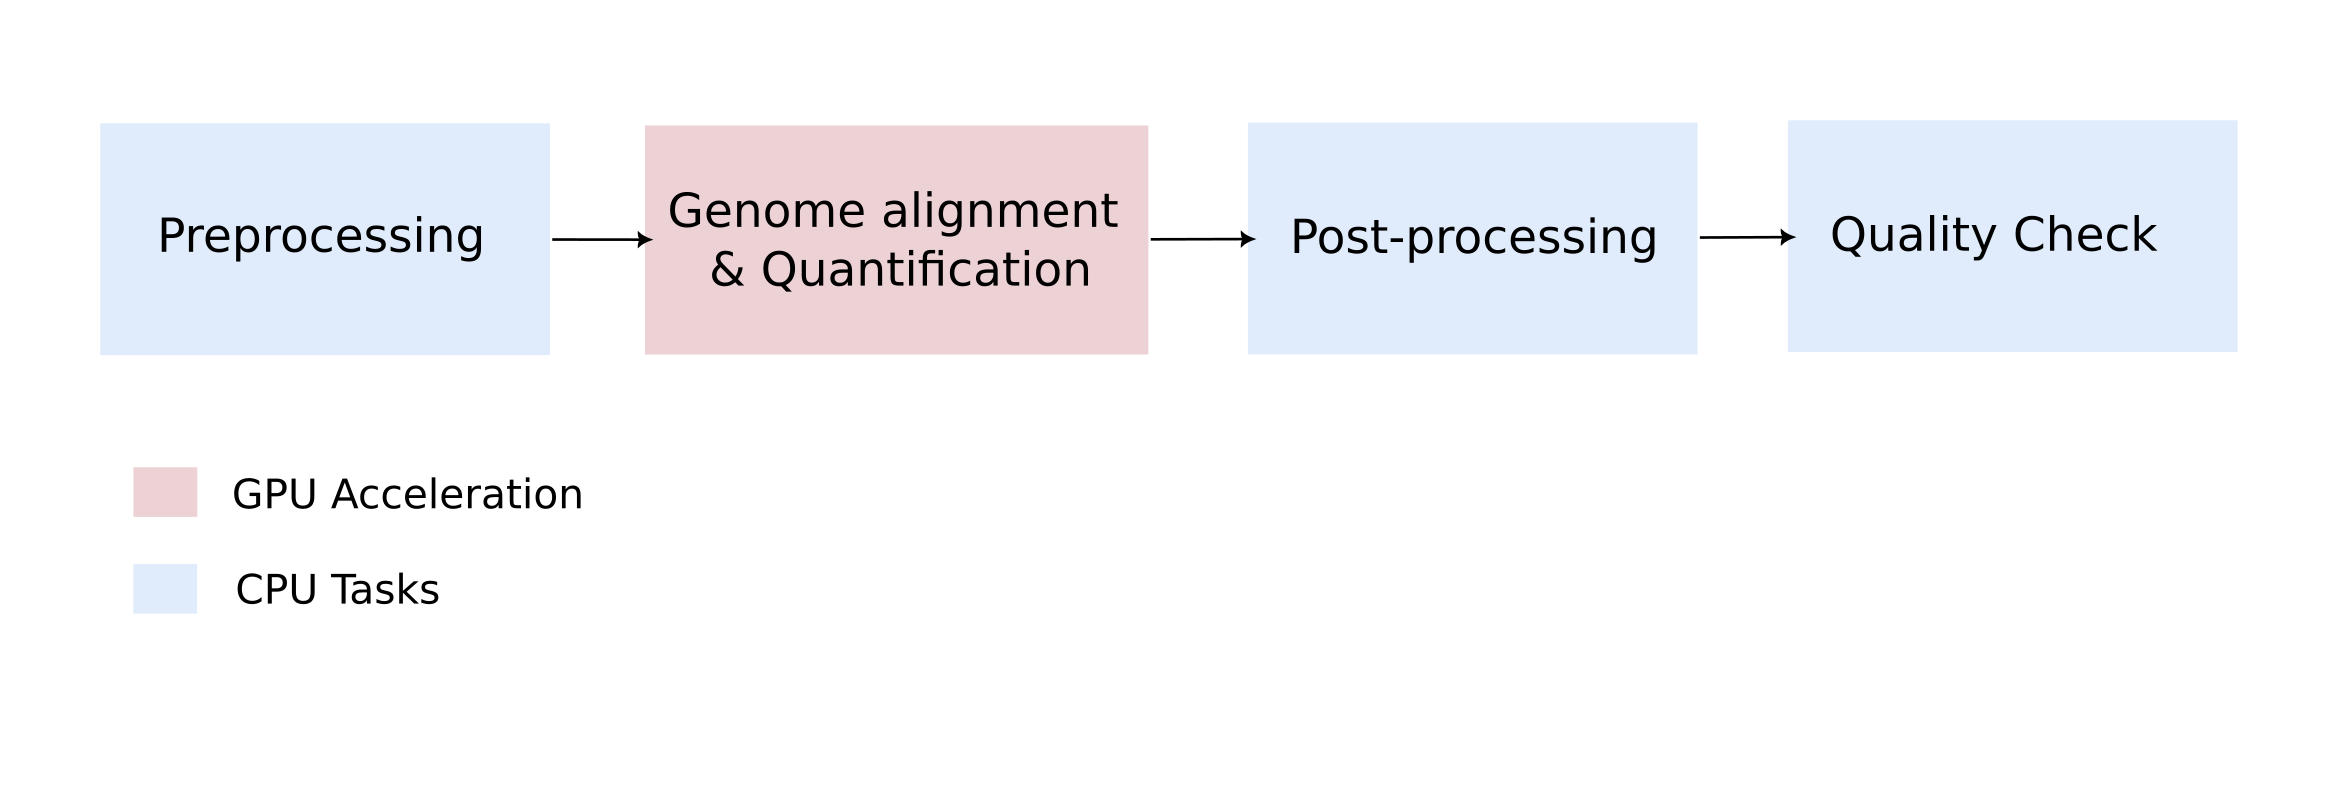
ATHOS-T (powered by Nvidia Parabricks) optimizes the data workflow with the following architecture to help users with a cost-effective solution for processing the raw transcriptomics data. We accelerate the most intensive steps using GPUs and perform the rest of the steps using CPUs.
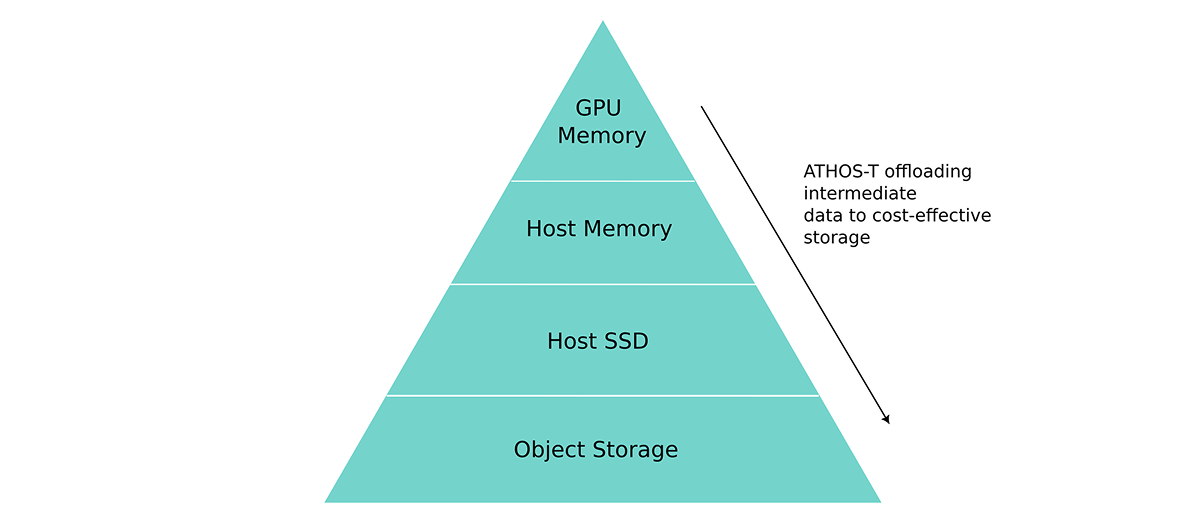
However, since the transcriptomics data size is big, optimizing the compute alone is not enough. We also need to optimize the data flow. When the GPUs work on alignment (BAM sorting and mark duplicates) it is much faster to store the data on GPU high-bandwidth RAM. When the tasks are finished, data can be offloaded to host RAM so that CPUs can take over for post-processing and quality check tasks. When the intermediate files are generated, they will be further offloaded to host SSD and object storage to save cost for users.
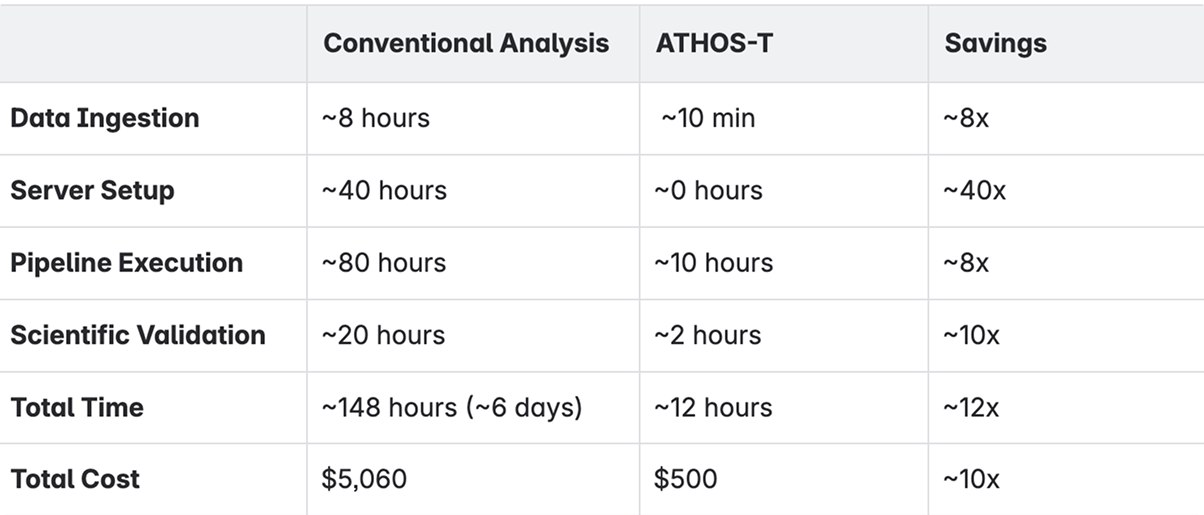
The overall performance comparison between ATHOS-T and conventional transcriptomics analyses is shown in the table below.
Conclusion
ATHOS-T is an innovative end-to-end transcriptomics data analysis solution that anyone with the data can utilize to empower their research across many industries.